- EUR/GBP has crashed back inside its multi-month range.
- It is falling to the range floor where it is likely to meet strong support.
- A break lower would activate downside targets based on the height of the range.
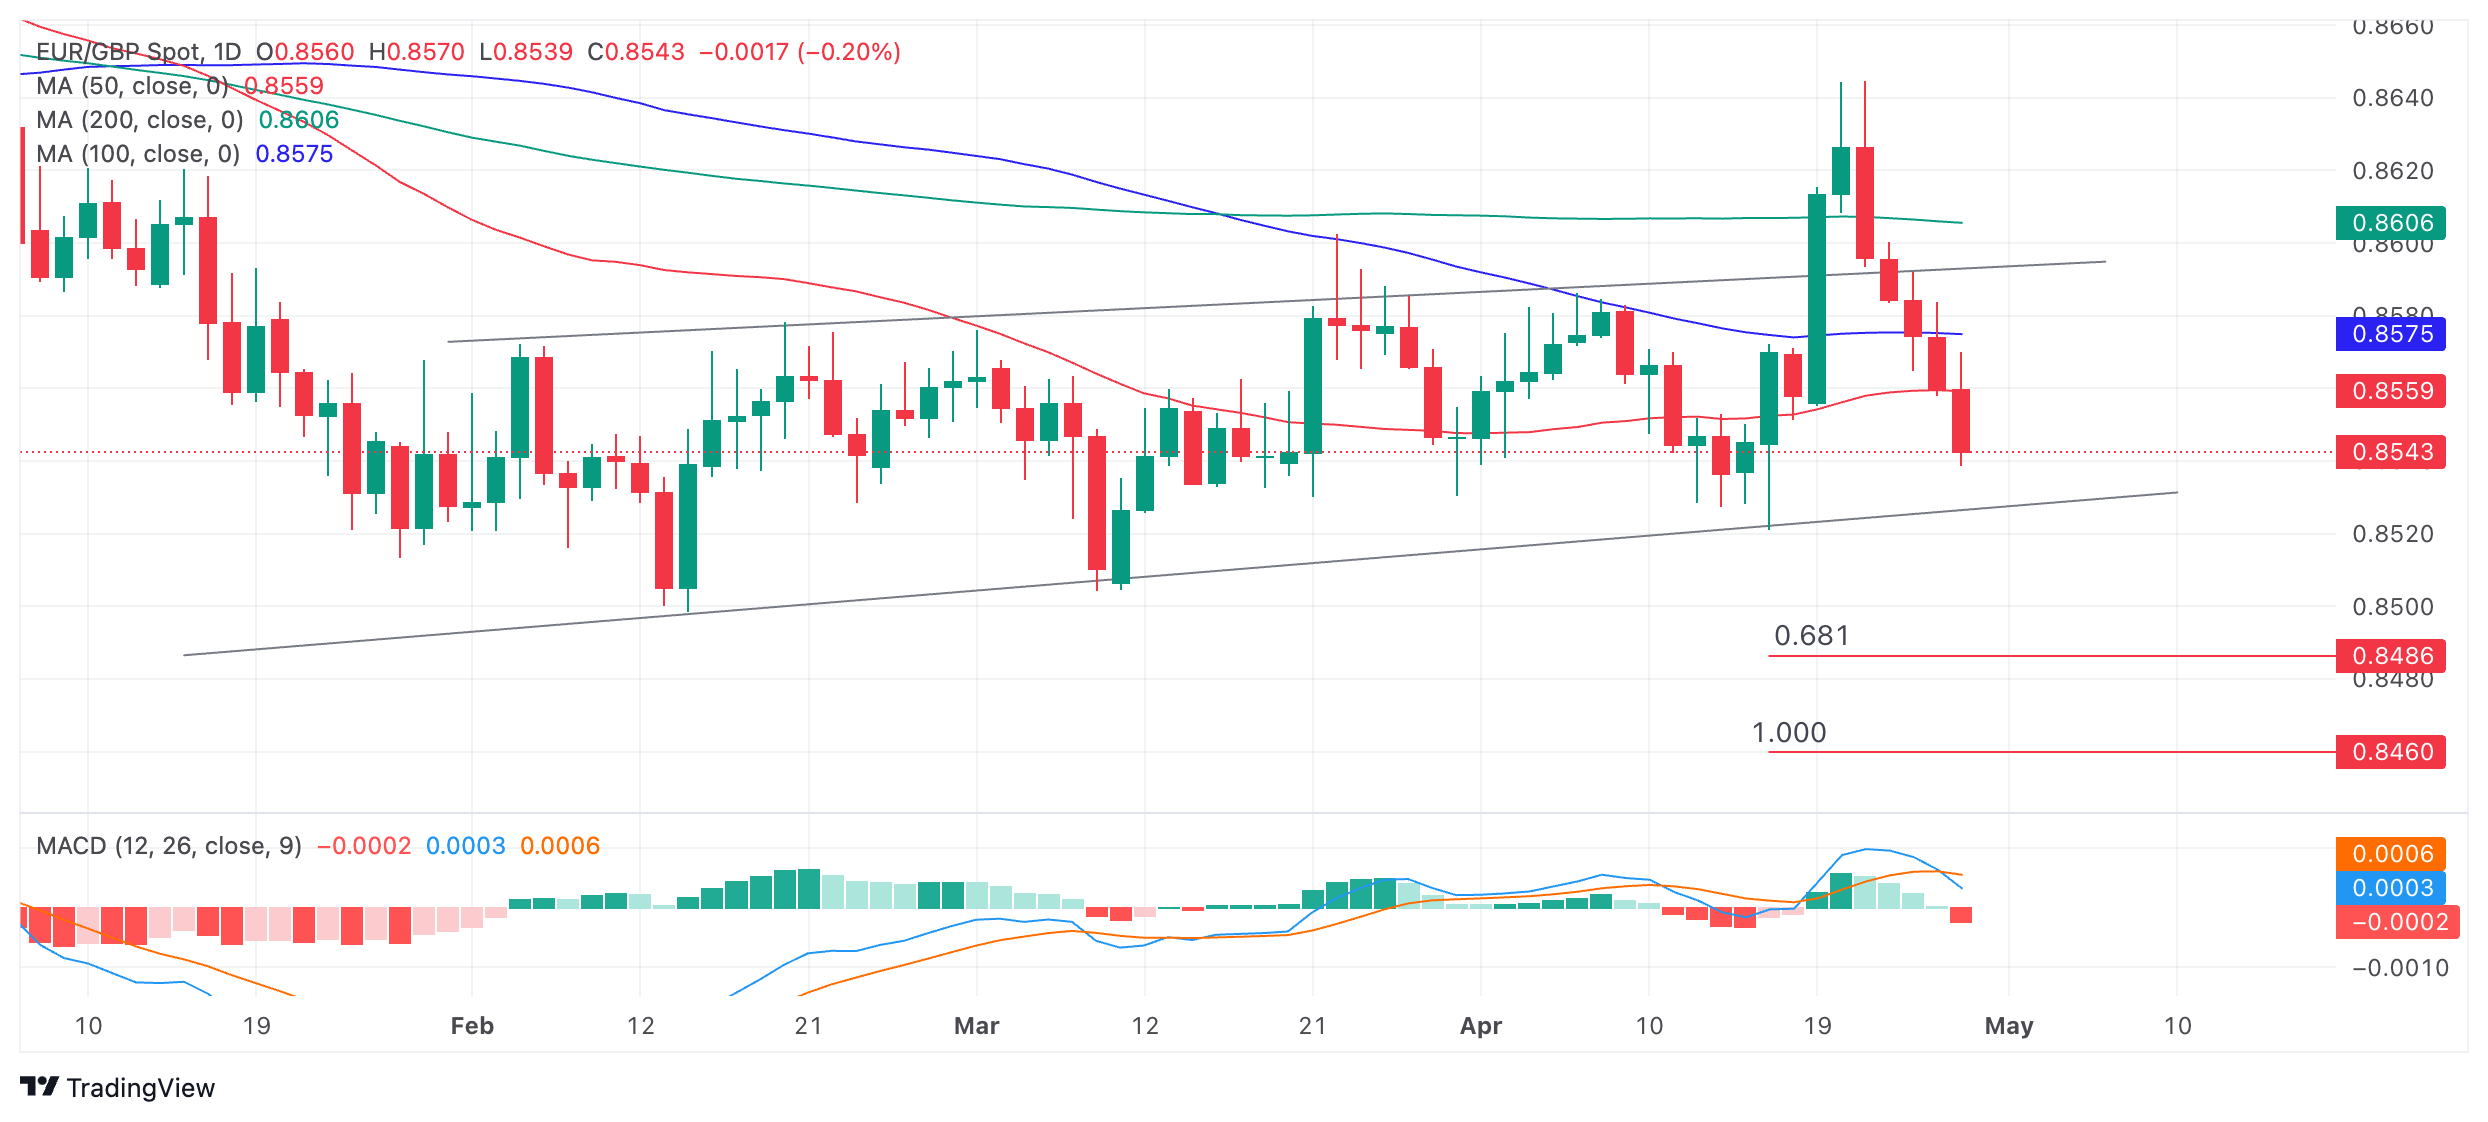
EUR/GBP is trading back inside its multi-month range after forming five down days in a row. The range stretches from roughly a ceiling level at 0.8600 and a floor at 0.8530.
EUR/GBP Daily Chart

EUR/GBP has fallen to 0.8541, which is quite close to the range floor at 0.8530. At the level of the range floor it is likely to encounter relatively tough support, and will probably bounce, at the very least temporarily.
A decisive break below the range low would open the way for more downside to the next target lower at 0.8486. This is the 0.681 Fibonacci ratio of the height of the range extrapolated down from the channel’s base, the method used by technical analysts to estimate range breakouts. Further weakness could even see price match the target at 0.8460.
EUR/GBP broke out of the top of its multi-month consolidation range on April 19 and rose up to a peak of 0.8645 before forming a Tweezer Top candlestick reversal pattern at the highs, reversing and tumbling back down. The Tweezer Top forms when two adjacent candlesticks peak, their wicks are of similar length, and end at the same or very similar levels.
The pair then declined rapidly, breaking back inside the range and is now on its way to the range lows.
EUR/GBP is in a sideways trend which is forecast to continue until a directional bias proves otherwise.
The Moving Average Convergence Divergence (MACD) indicator has just crossed below its signal line, giving a sell signal and indicating more downside. The signal is improved by the fact the pair is in a sideways trend and MACD is proven to be a more reliable indicator in non-trending markets.
Information on these pages contains forward-looking statements that involve risks and uncertainties. Markets and instruments profiled on this page are for informational purposes only and should not in any way come across as a recommendation to buy or sell in these assets. You should do your own thorough research before making any investment decisions. FXStreet does not in any way guarantee that this information is free from mistakes, errors, or material misstatements. It also does not guarantee that this information is of a timely nature. Investing in Open Markets involves a great deal of risk, including the loss of all or a portion of your investment, as well as emotional distress. All risks, losses and costs associated with investing, including total loss of principal, are your responsibility. The views and opinions expressed in this article are those of the authors and do not necessarily reflect the official policy or position of FXStreet nor its advertisers. The author will not be held responsible for information that is found at the end of links posted on this page.
If not otherwise explicitly mentioned in the body of the article, at the time of writing, the author has no position in any stock mentioned in this article and no business relationship with any company mentioned. The author has not received compensation for writing this article, other than from FXStreet.
FXStreet and the author do not provide personalized recommendations. The author makes no representations as to the accuracy, completeness, or suitability of this information. FXStreet and the author will not be liable for any errors, omissions or any losses, injuries or damages arising from this information and its display or use. Errors and omissions excepted.
The author and FXStreet are not registered investment advisors and nothing in this article is intended to be investment advice.
